Kaizen
Graph-powered root-cause analysis that names the commit and function behind a broken deploy, with the evidence, then proposes a revert that merges only after a person approves it.
- Python
- FastAPI
- FalkorDB
- PostgreSQL
- Next.js
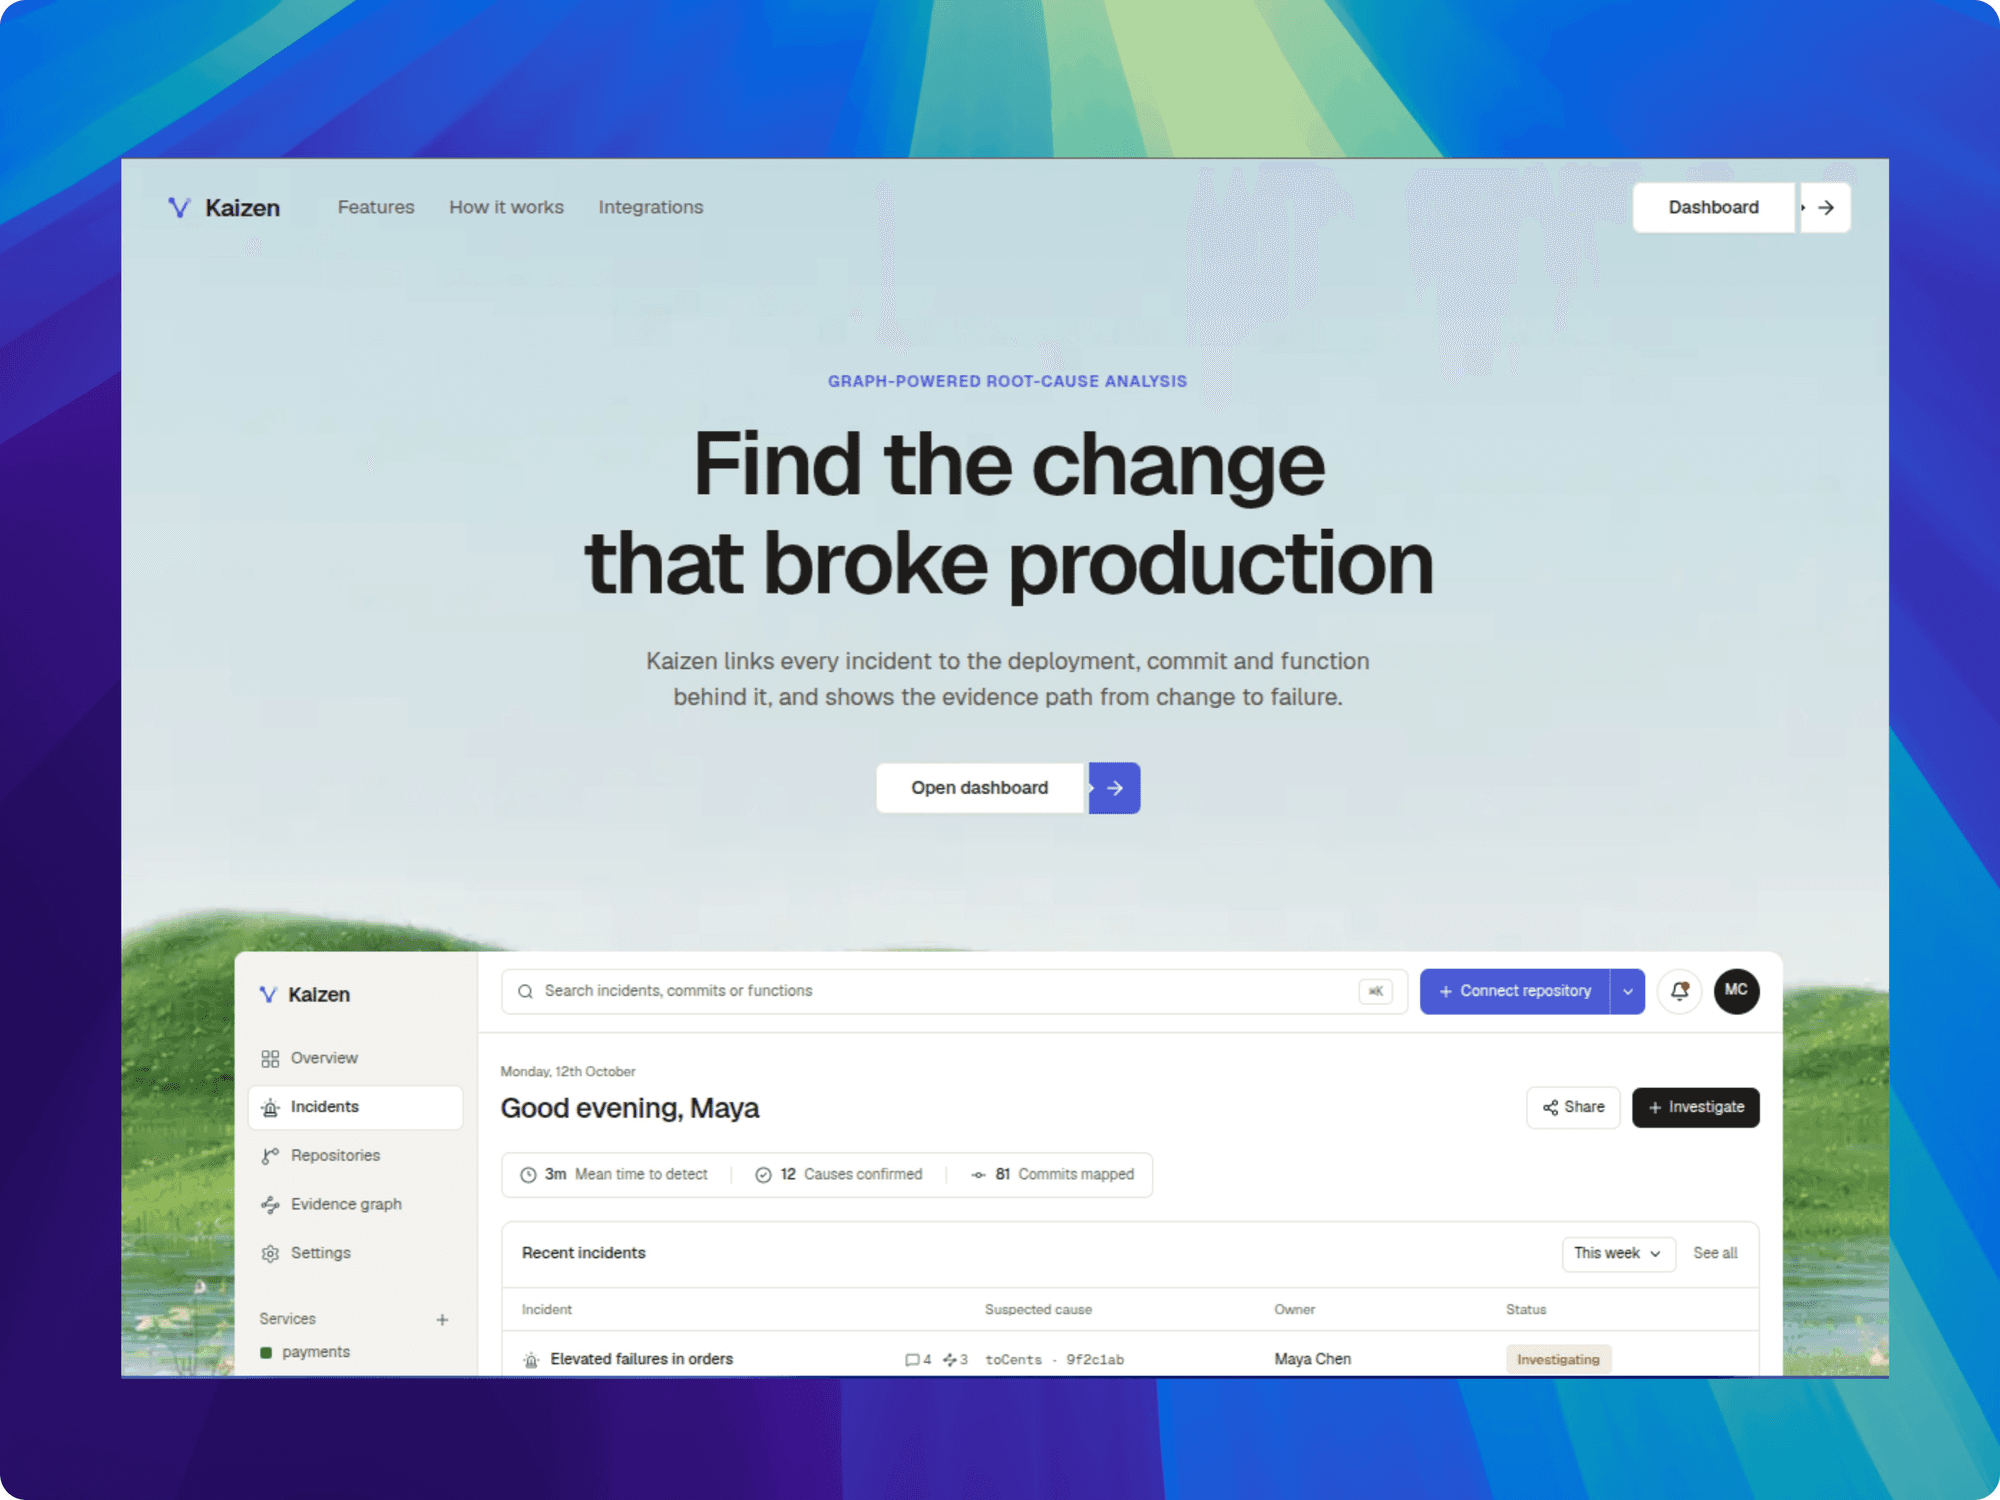
When a deploy breaks production, the usual first guess is the newest commit. On 28 failure scenarios we built, that guess was right 32% of the time, and keyword search over commit messages got 39%. Both treat commits as text. Kaizen asks the question a graph can answer: which commit changed a function on the call path of the function that threw?
What it is
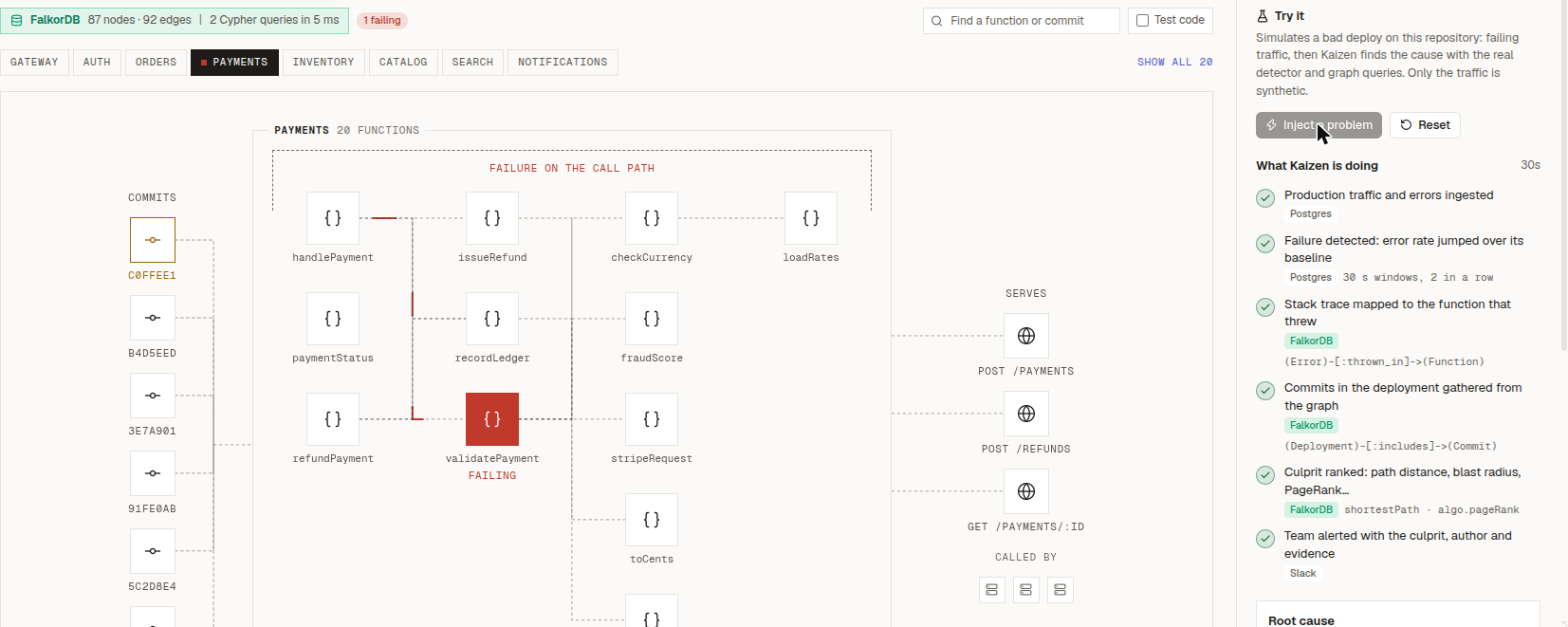
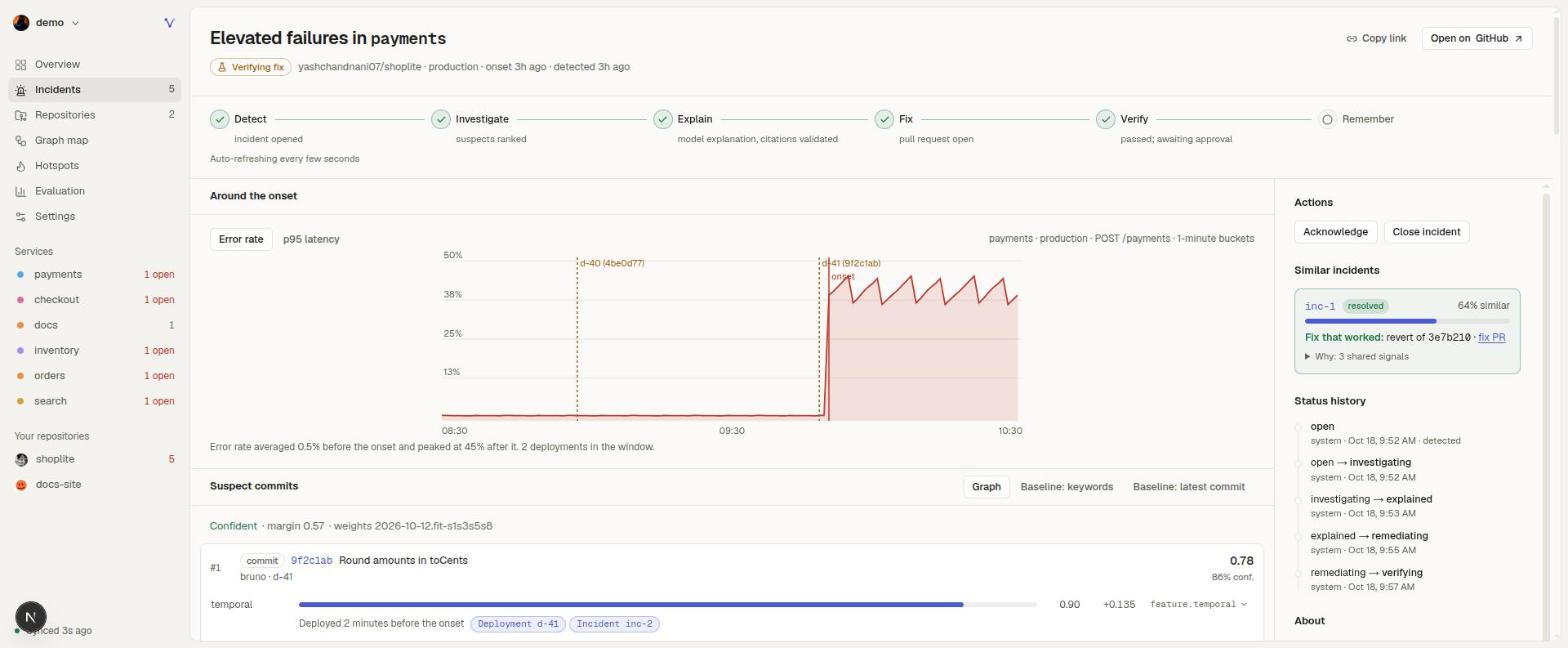
Kaizen keeps a repository as a FalkorDB graph of commits, functions, call paths, endpoints, services and deployments. When the error rate jumps, the stack trace is attached to the function that threw, and each commit in the deployment is scored by walking the graph back to the change. The team gets a Slack alert with the culprit, the author and the evidence. It was built for Graph Hacks (WeMakeDevs × FalkorDB) in October 2026; the full walkthrough is in the blog post.
How it works
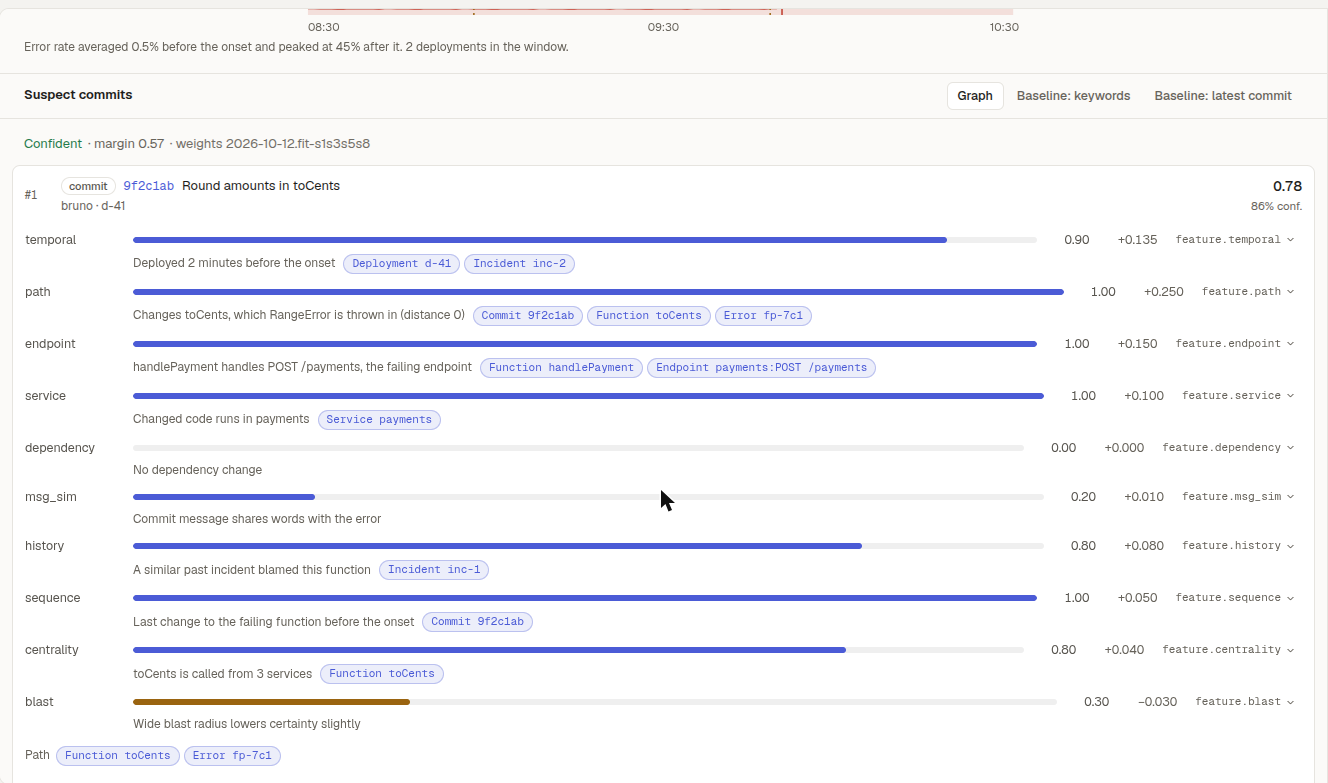
- Ten graph features, fixed weights. Every suspect commit gets ten Cypher-backed scores (path distance to the failing function, endpoint, timing, PageRank centrality, a similar past incident and more), each with the graph ids it used. Right commit first in 89% of scenarios, never confidently wrong.
- The LLM explains, it doesn't decide. The model writes the explanation after the ranking is fixed, and every claim must cite graph ids a validator checks. Close calls are marked ambiguous instead of guessed.
- Postgres for time, FalkorDB for hops. Telemetry windows and app state live in Postgres; multi-hop questions go to the graph.
- Safe fixes. A revert goes to a
kaizen/fix-<incident>branch, the target repo's CI replays the failing traffic on staging, and nothing merges without approval.
My part
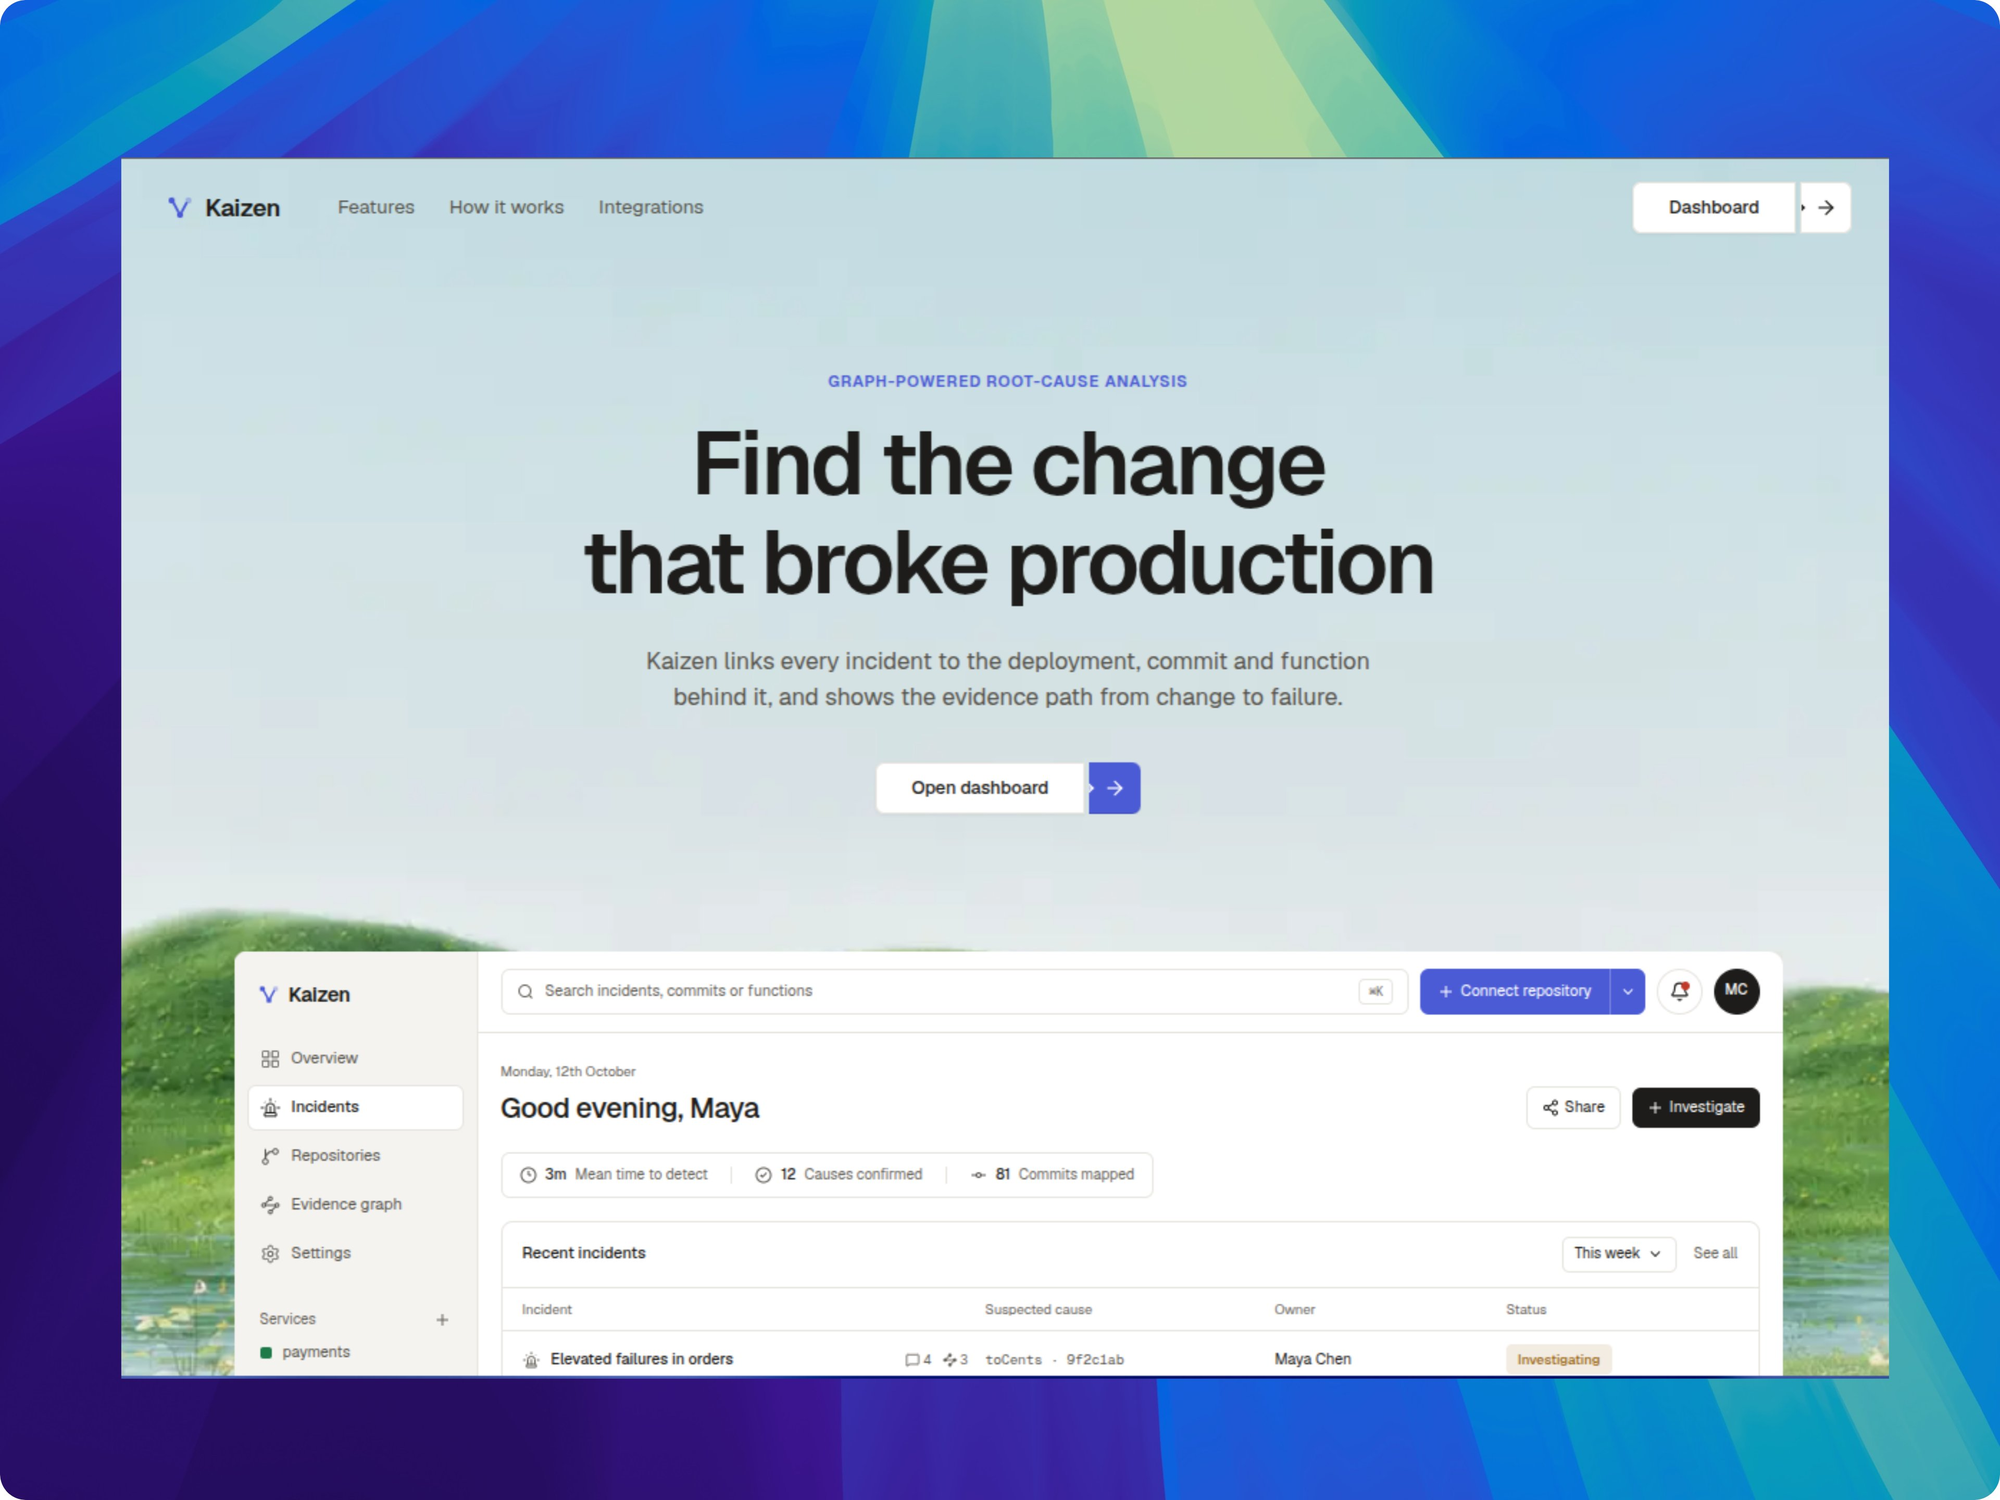
I set up the initial project scaffold and built most of the web app: the dashboard shell, the incident evidence graph, the landing page and the GitHub sign-in flow. Kaizen was built with Yash Chandnani, Sanskar Joshi and Kamran Pathan, and is live at kaizen.akkki.tech.