The latest commit was guilty 32% of the time
When a deploy breaks production, the usual guess is the newest commit. We measured it: right 32% of the time. Kaizen, our Graph Hacks build on FalkorDB, walks the call graph from the error back to the change and gets 89%.
- falkordb
- knowledge-graph
- hackathon
- root-cause-analysis
- observability
- cypher
- postgres
- ai-agents
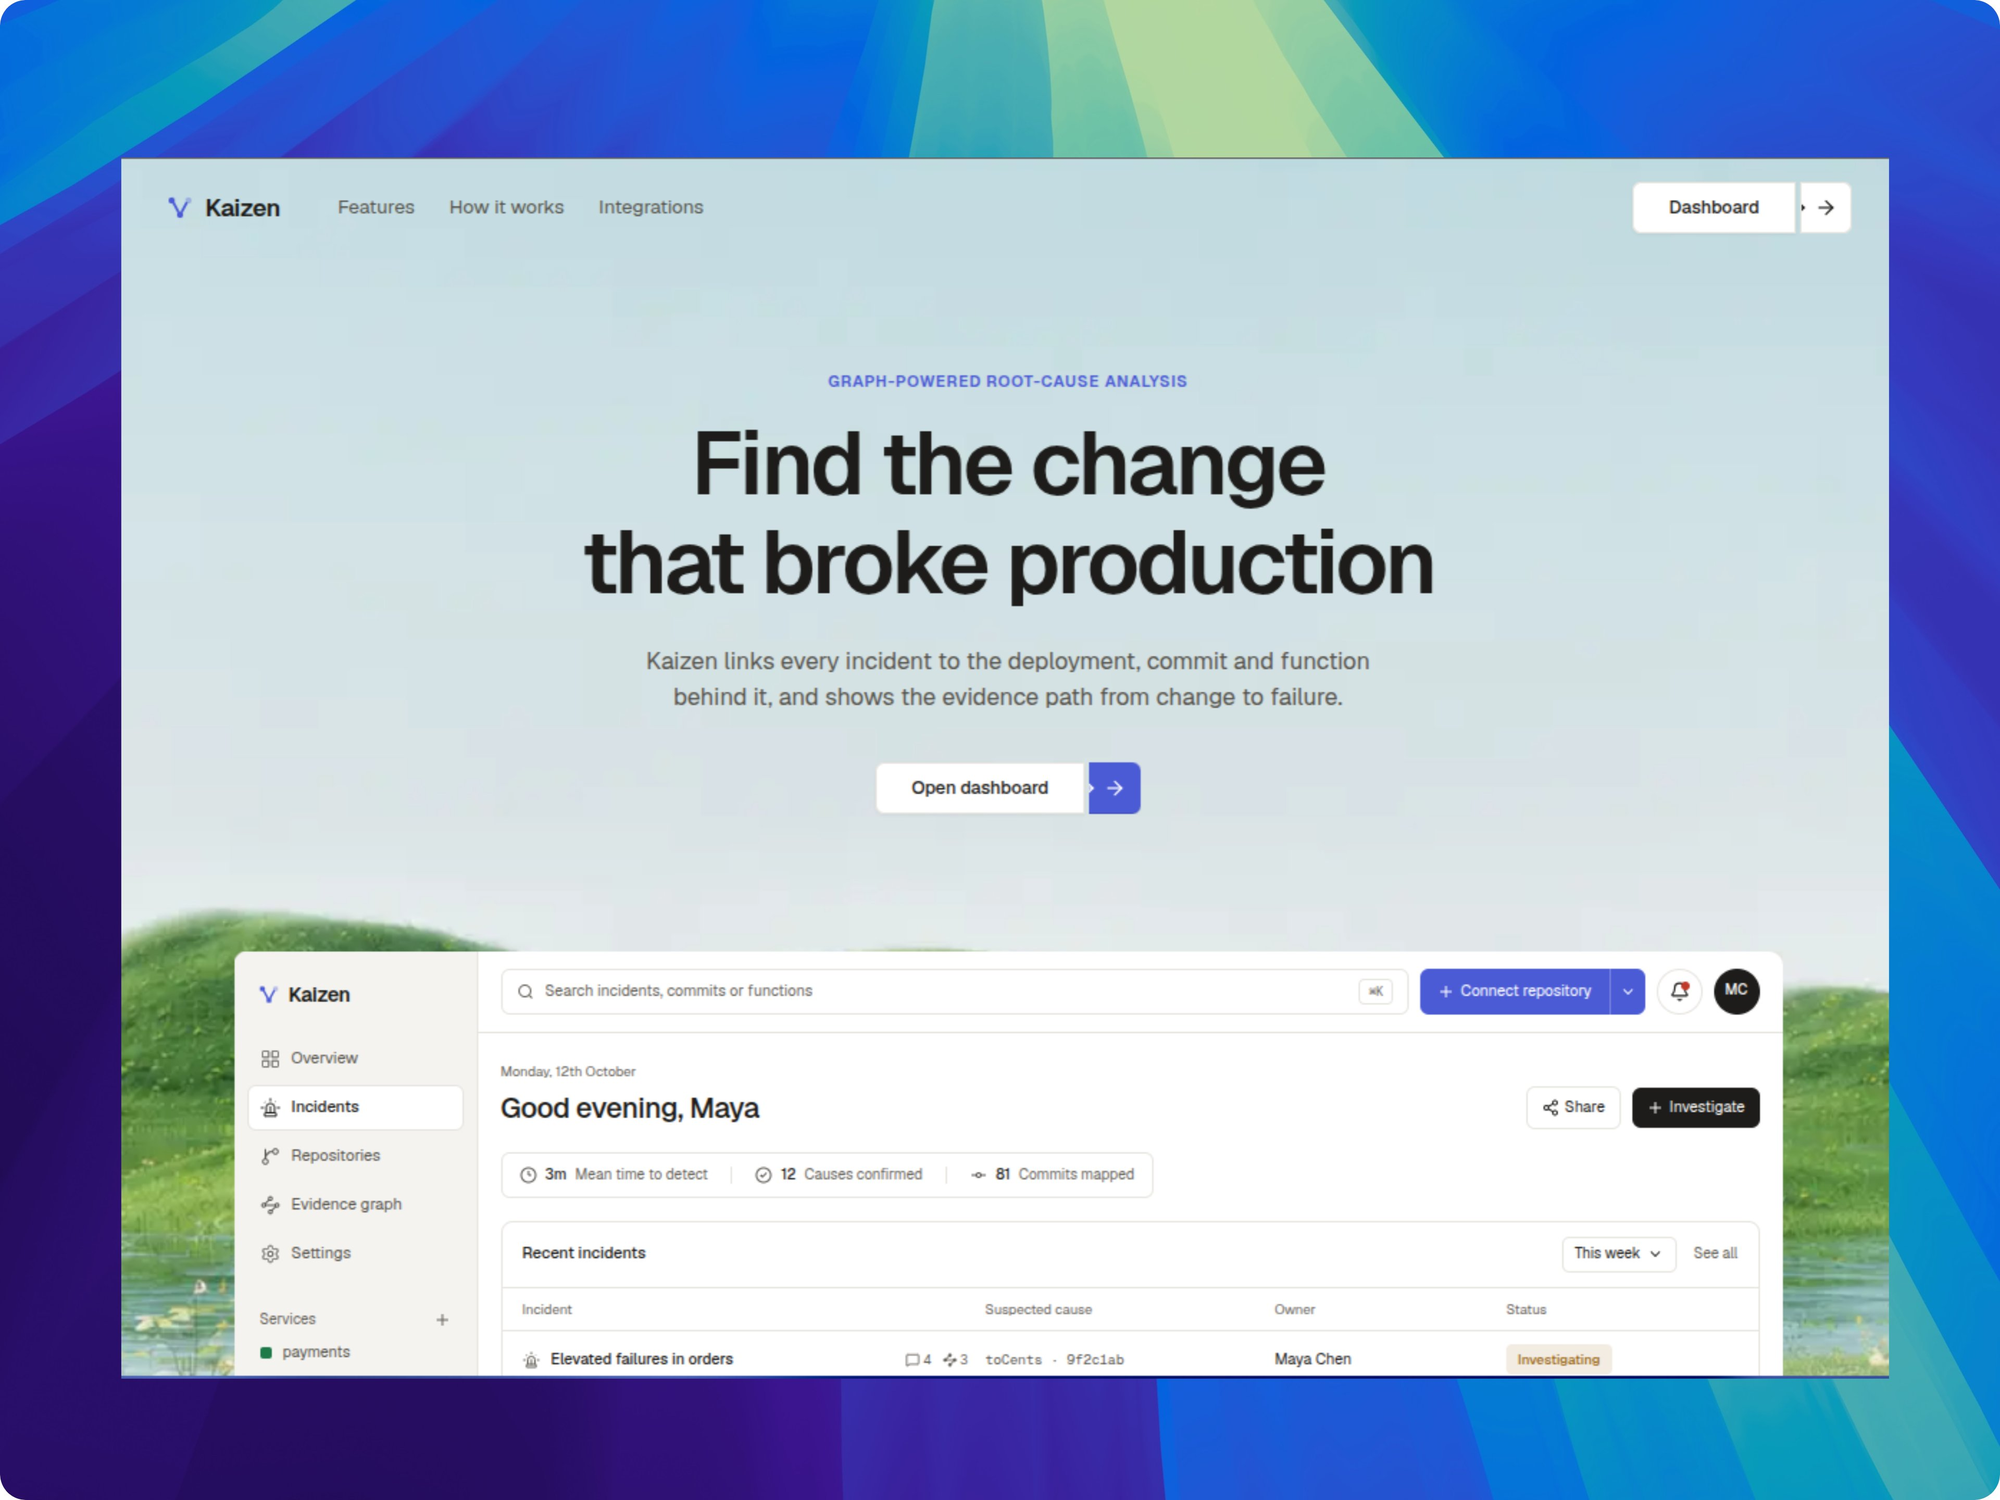
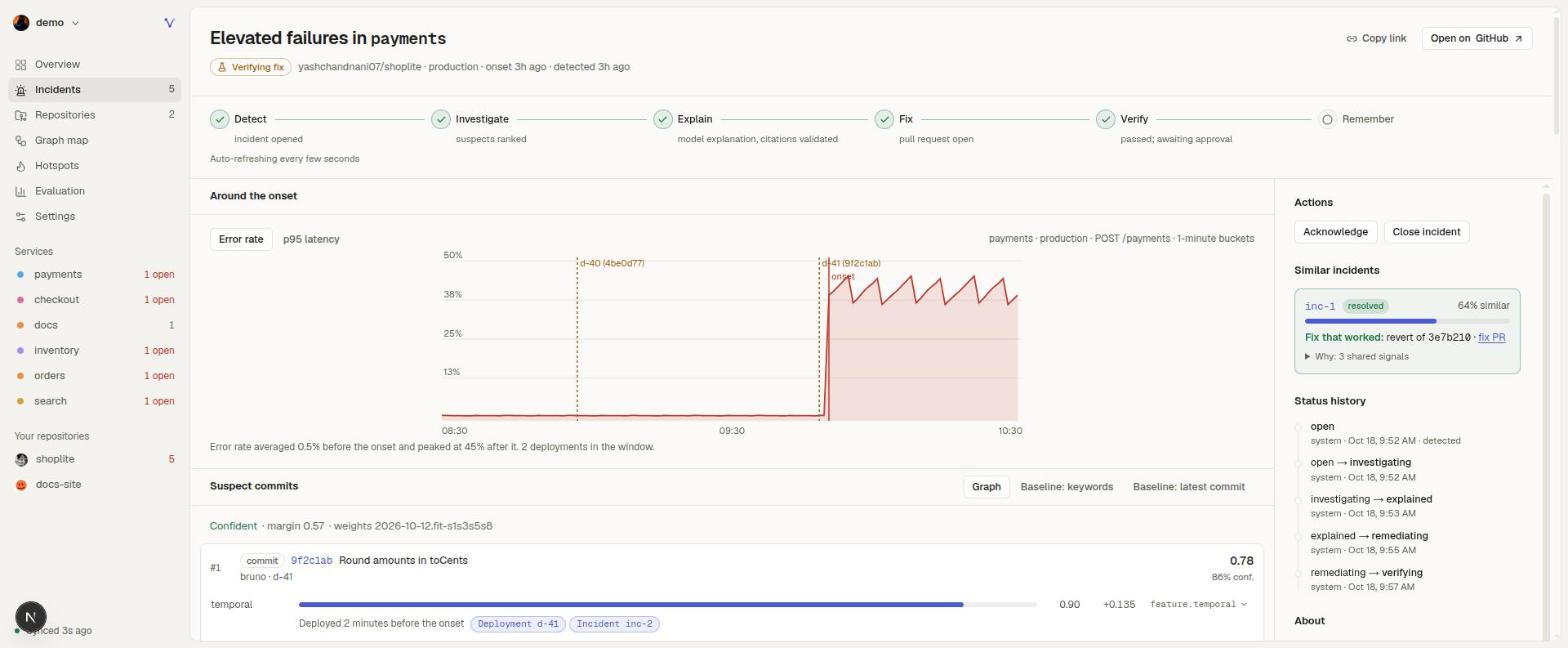
We built Kaizen for Graph Hacks (WeMakeDevs × FalkorDB, October 15 to 18, 2026). It watches a running app and, when a deploy breaks it, names the commit and the function behind the failure, with the evidence. Then it opens a revert and waits for a person to approve it.
Live demo: https://kaizen.akkki.tech (click Try the demo, no GitHub account needed). Code: https://github.com/akkki007/kaizen.
The problem
Something breaks right after a deploy. The deployment had several commits, and the on-call engineer has to work out which one did it. The usual first guess is the most recent commit, followed by searching commit messages for words from the error.
We measured both habits. Across the 28 failure scenario variants we built on ShopLite, a small e-commerce app with payments, orders and inventory, the most recent commit was the culprit 32% of the time. Keyword search got 39%.
BM25 — the standard keyword-ranking formula behind most search engines. It scores a document by how often the query's words appear in it, discounting words that appear everywhere. Here the "documents" were commit messages, file paths and function names.
Both miss for the same reason. They treat commits as text and ignore what the code does. A commit that touches toCents matters when toCents is called by the function that is throwing, and keyword search has no way to know that.
The idea: walk from the error to the change
Kaizen keeps the repository as a graph in FalkorDB: commits, the functions they changed, which functions call which, the endpoints those functions serve, and the services they belong to. When an error arrives, it is attached to the function that threw it. Finding the culprit then becomes a walk through the graph:
commit -> function it changed -> call path -> function that threw -> endpoint -> service
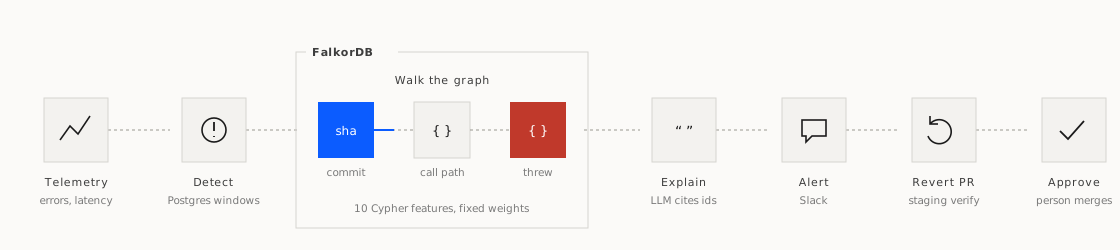
Postgres holds application state and raw telemetry. It answers "did the error rate jump in the last two 30-second windows?". FalkorDB answers the multi-hop questions, such as "how far is this commit's change from the function that threw?". Call paths in Postgres would mean slow recursive SQL, and raw telemetry samples would bloat the graph.
How a suspect gets ranked
Every candidate commit in the failing deployment gets ten feature scores. Each one is a Cypher query that returns a value, the graph ids it used and a sentence explaining it: path distance to the failing function, whether the change sits behind the failing endpoint, timing relative to the onset, PageRank centrality, a similar past incident, and so on. A fixed, versioned set of weights adds them up.
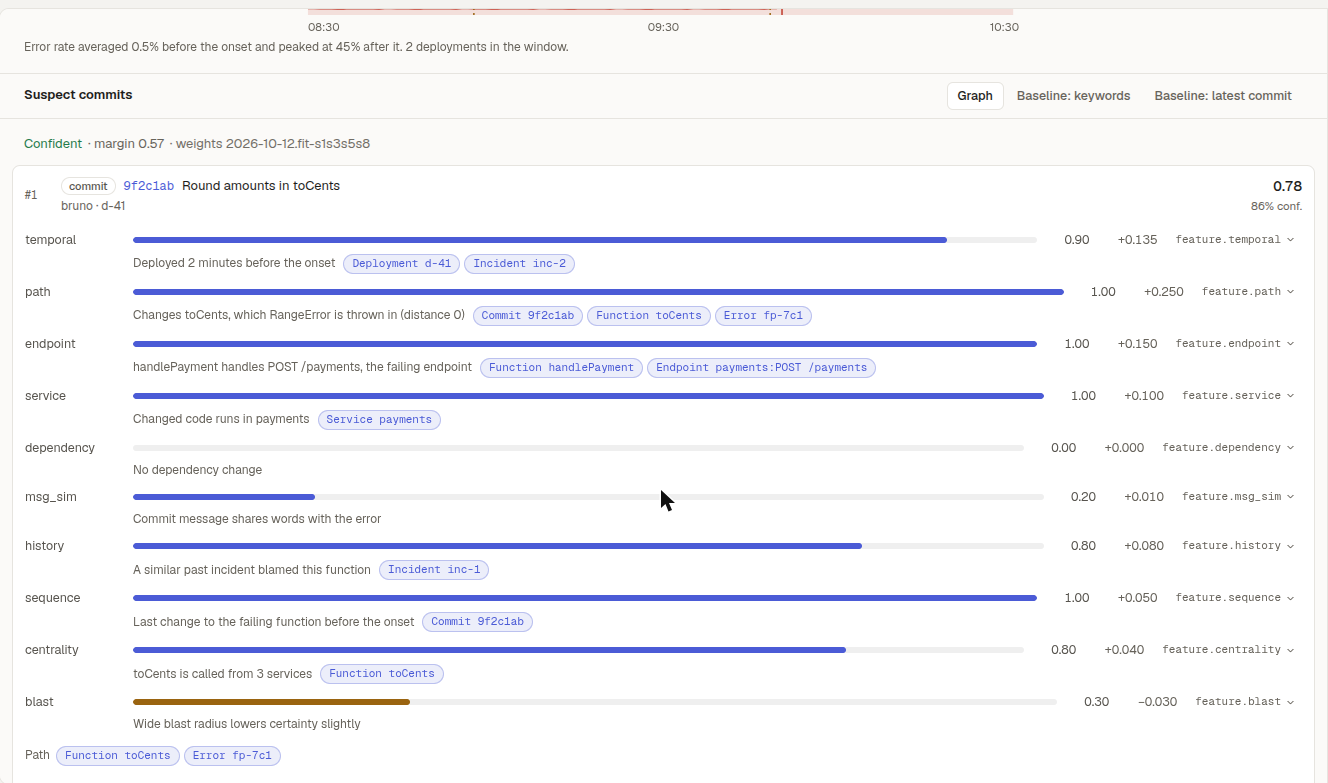
The language model does not pick the culprit. It writes the explanation after the ranking is decided, and every claim must cite graph ids that a validator checks. If the ranking is confident, the model cannot override it. When the margin between suspects is small, the result is marked "ambiguous" and the top three are shown as tentative. With no function-level evidence at all, it reports "no code evidence".
Results
On the same 28 scenarios, with distractor commits mixed in:
Top-1 / Top-3 — the share of scenarios where the real culprit was ranked first, or anywhere in the first three. False attribution — the share where the method confidently named the wrong commit.
| Method | Top-1 | Top-3 | False attribution |
|---|---|---|---|
| Kaizen graph score | 89% | 100% | 0% |
| Graph score without the path feature | 57% | 100% | 11% |
| BM25 keywords | 39% | 79% | 61% |
| Most recent commit | 32% | 54% | 68% |
Read the first row again. The 11% Kaizen didn't get at top-1 were never confidently wrong; they came back flagged instead of naming the wrong commit. For an on-call engineer, "I'm not sure, here are three" is far cheaper than a wrong answer delivered with confidence.
On the held-out split, which we never tuned on, the graph score gets 83% top-1 against 44% for BM25 and 28% for the latest commit. Detection to a ranked hypothesis takes about 194 ms (p50), before the LLM writes anything.
Fixing it safely
The default fix is a revert of the culprit commit, because a revert is small and easy to review. Kaizen pushes it to a kaizen/fix-<incident> branch, never to main. The target repo's own GitHub Actions run the tests, deploy to staging and replay the recorded failing traffic. Nothing merges until someone with push access approves it.
Seeing the graph
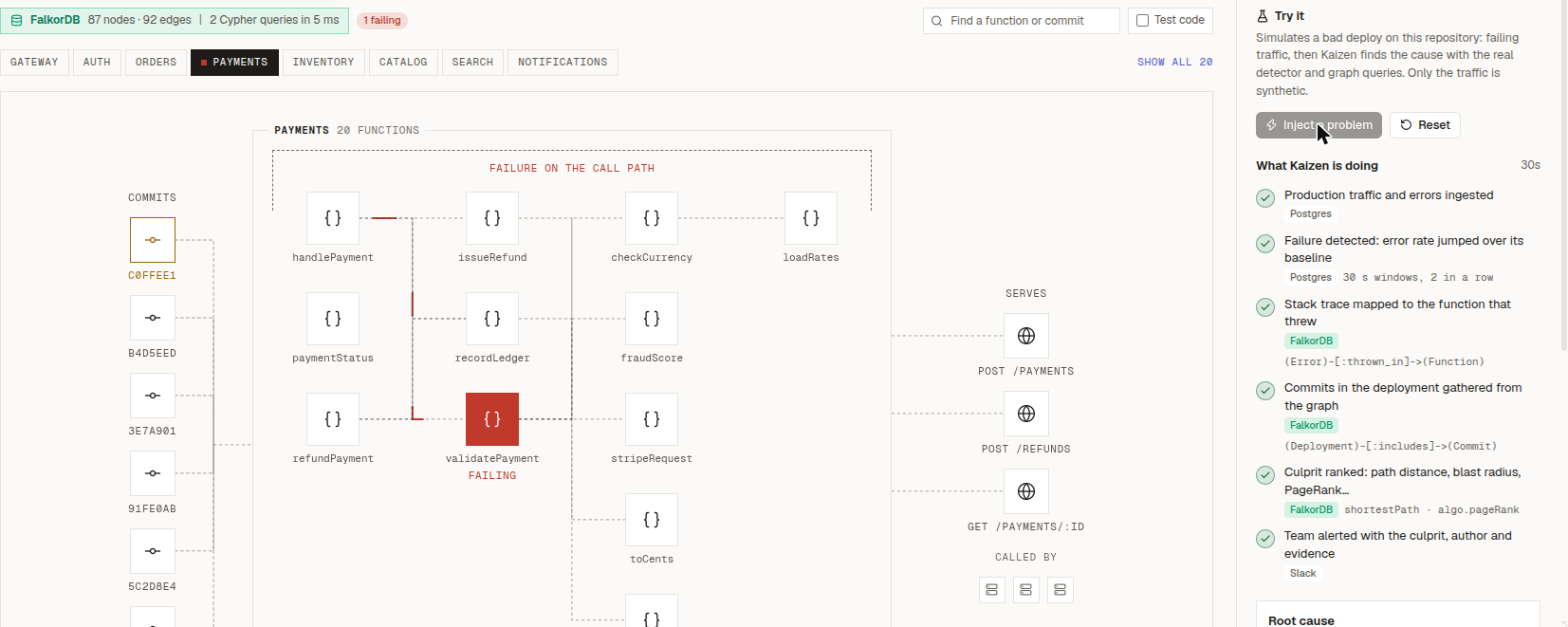
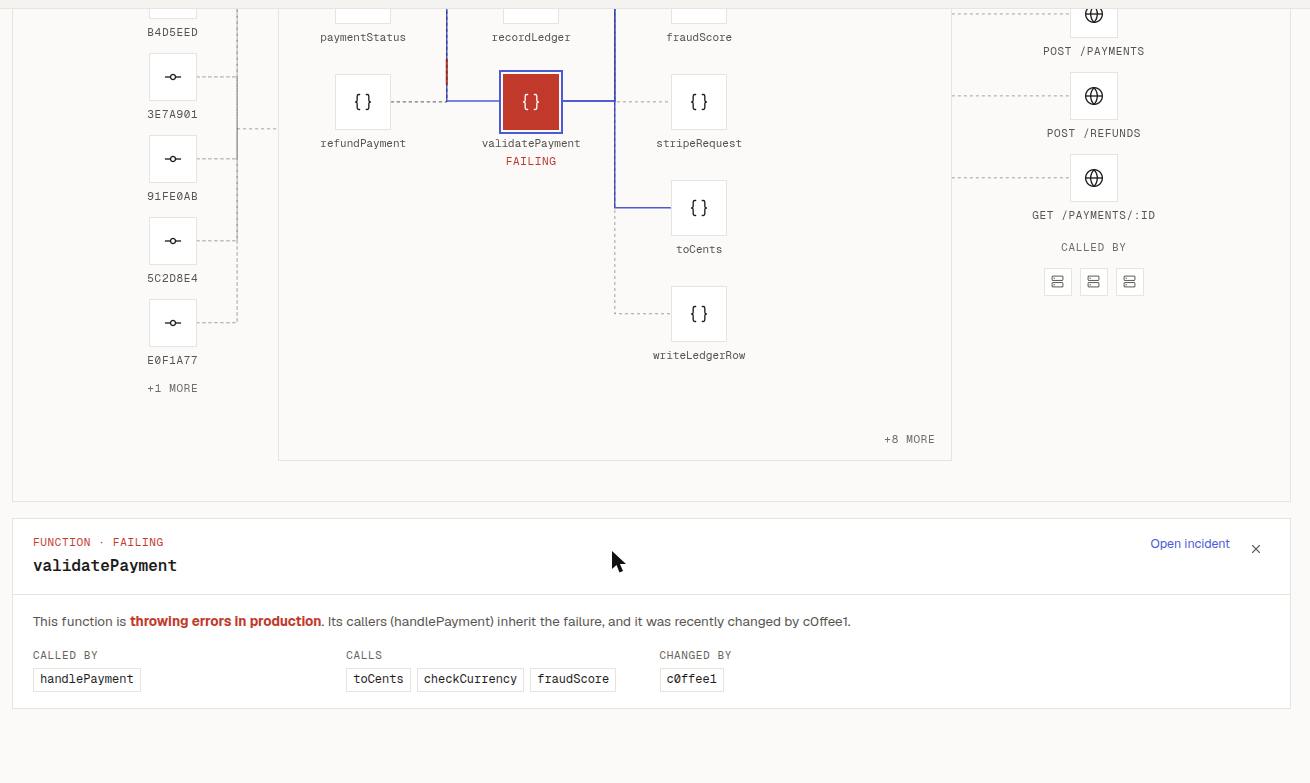
The first version drew every function, service and commit in one canvas, and with all of them on screen it was hard to read. We replaced it with the Graph map: one service at a time, read left to right. Commits are on the left, the service's functions in columns by call depth, and the endpoints it serves on the right. When something fails, only that function turns red, and clicking any node explains what calls it, what it calls and which commit changed it.
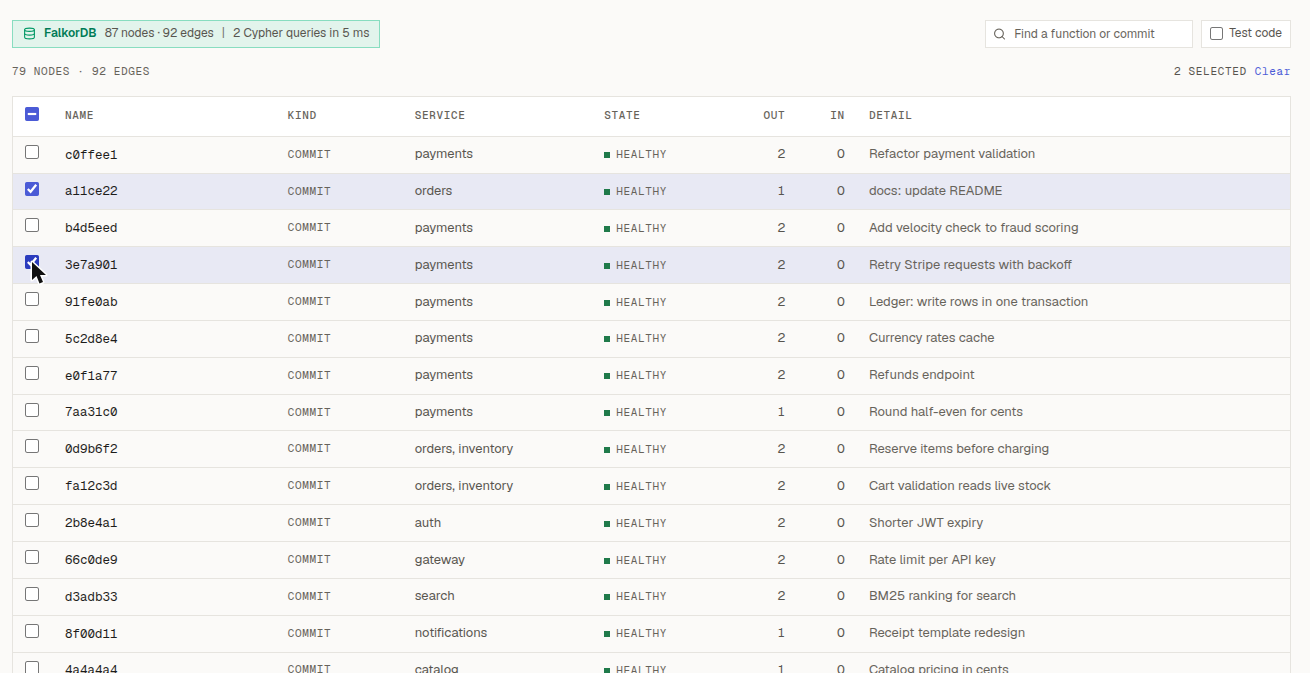
The same data is also a selectable table, which is easier for scanning or searching every node. The screenshots use the demo repository.
What we learned
The call path did most of the work. Turning the path feature off dropped top-1 from 89% to 57%. Turning off history or dependency changes made no difference on our scenarios. Whether the changed code sits on the failing call path decides most cases, and that question needs a graph.
Fitting the weights made things worse. We fitted them on the tuning split, and they scored lower on the held-out data than the hand-set weights. With 28 scenarios that is easy to do by accident, so we kept the hand-set weights and kept a guard that stops fitting from seeing test data.
We kept the LLM out of the ranking for three reasons. A model choosing the culprit gives different answers between runs and model versions. It costs money on every evaluation run. And commit messages and log lines are text an attacker controls, which the model would read and could be steered by. Making it explain a decision that plain code already made, with citations checked against the graph, removed all three problems.
One background job per event was too slow. At 1,000 events a second the first ingest path managed 531, with a median batch latency of 18 seconds. Storing telemetry rows directly from the API and running at most one graph job per batch brought it to 496 events a second sustained at a 500 target, with p95 of 431 ms per batch.
Shared status fields cause stuck incidents. Detection, investigation, remediation and people all used to write an incident's status directly, so a failed job could leave an incident stuck in "investigating", or a job could overwrite a person's decision. Every change now goes through one state machine, and background jobs can only move an incident forward from states they expect.
Graph views need help at scale. With 20 functions in one service, lines between neighbouring columns start to share the same vertical track and become hard to follow. Capping the view at 12 functions (failing ones and entry points first) and highlighting a node's own lines on click helped. Proper edge routing is still on the list.
What is not done yet
Function mapping covers JavaScript and TypeScript only. The agent's explanations have run on five scenarios and on demo incidents in production, but we have not measured them as a benchmark. Connected repositories still have to send telemetry with a snippet; a one-click setup is planned.
The scenarios, the evaluation harness and every number above are in the repository, and make eval reproduces the table.
If you keep one thing
The commit that broke production is almost always the one whose change sits on the failing call path, and finding that path is a graph walk, not a text search.
Sources
- The Kaizen repository: the 28 ShopLite failure scenarios, the evaluation harness (
make eval), and the ingest load tests. Every number in this post comes from those runs. - FalkorDB for the graph store and Cypher queries, including
shortestPathandalgo.pageRank. - Graph Hacks by WeMakeDevs × FalkorDB, October 15 to 18, 2026.
- Screenshots are from the live deployment using the demo repository, October 2026.